Basis of the threshold
Market prices, management costs, and time between crop inspection and pest control should all factor into deciding the need for taking action control a pest population.
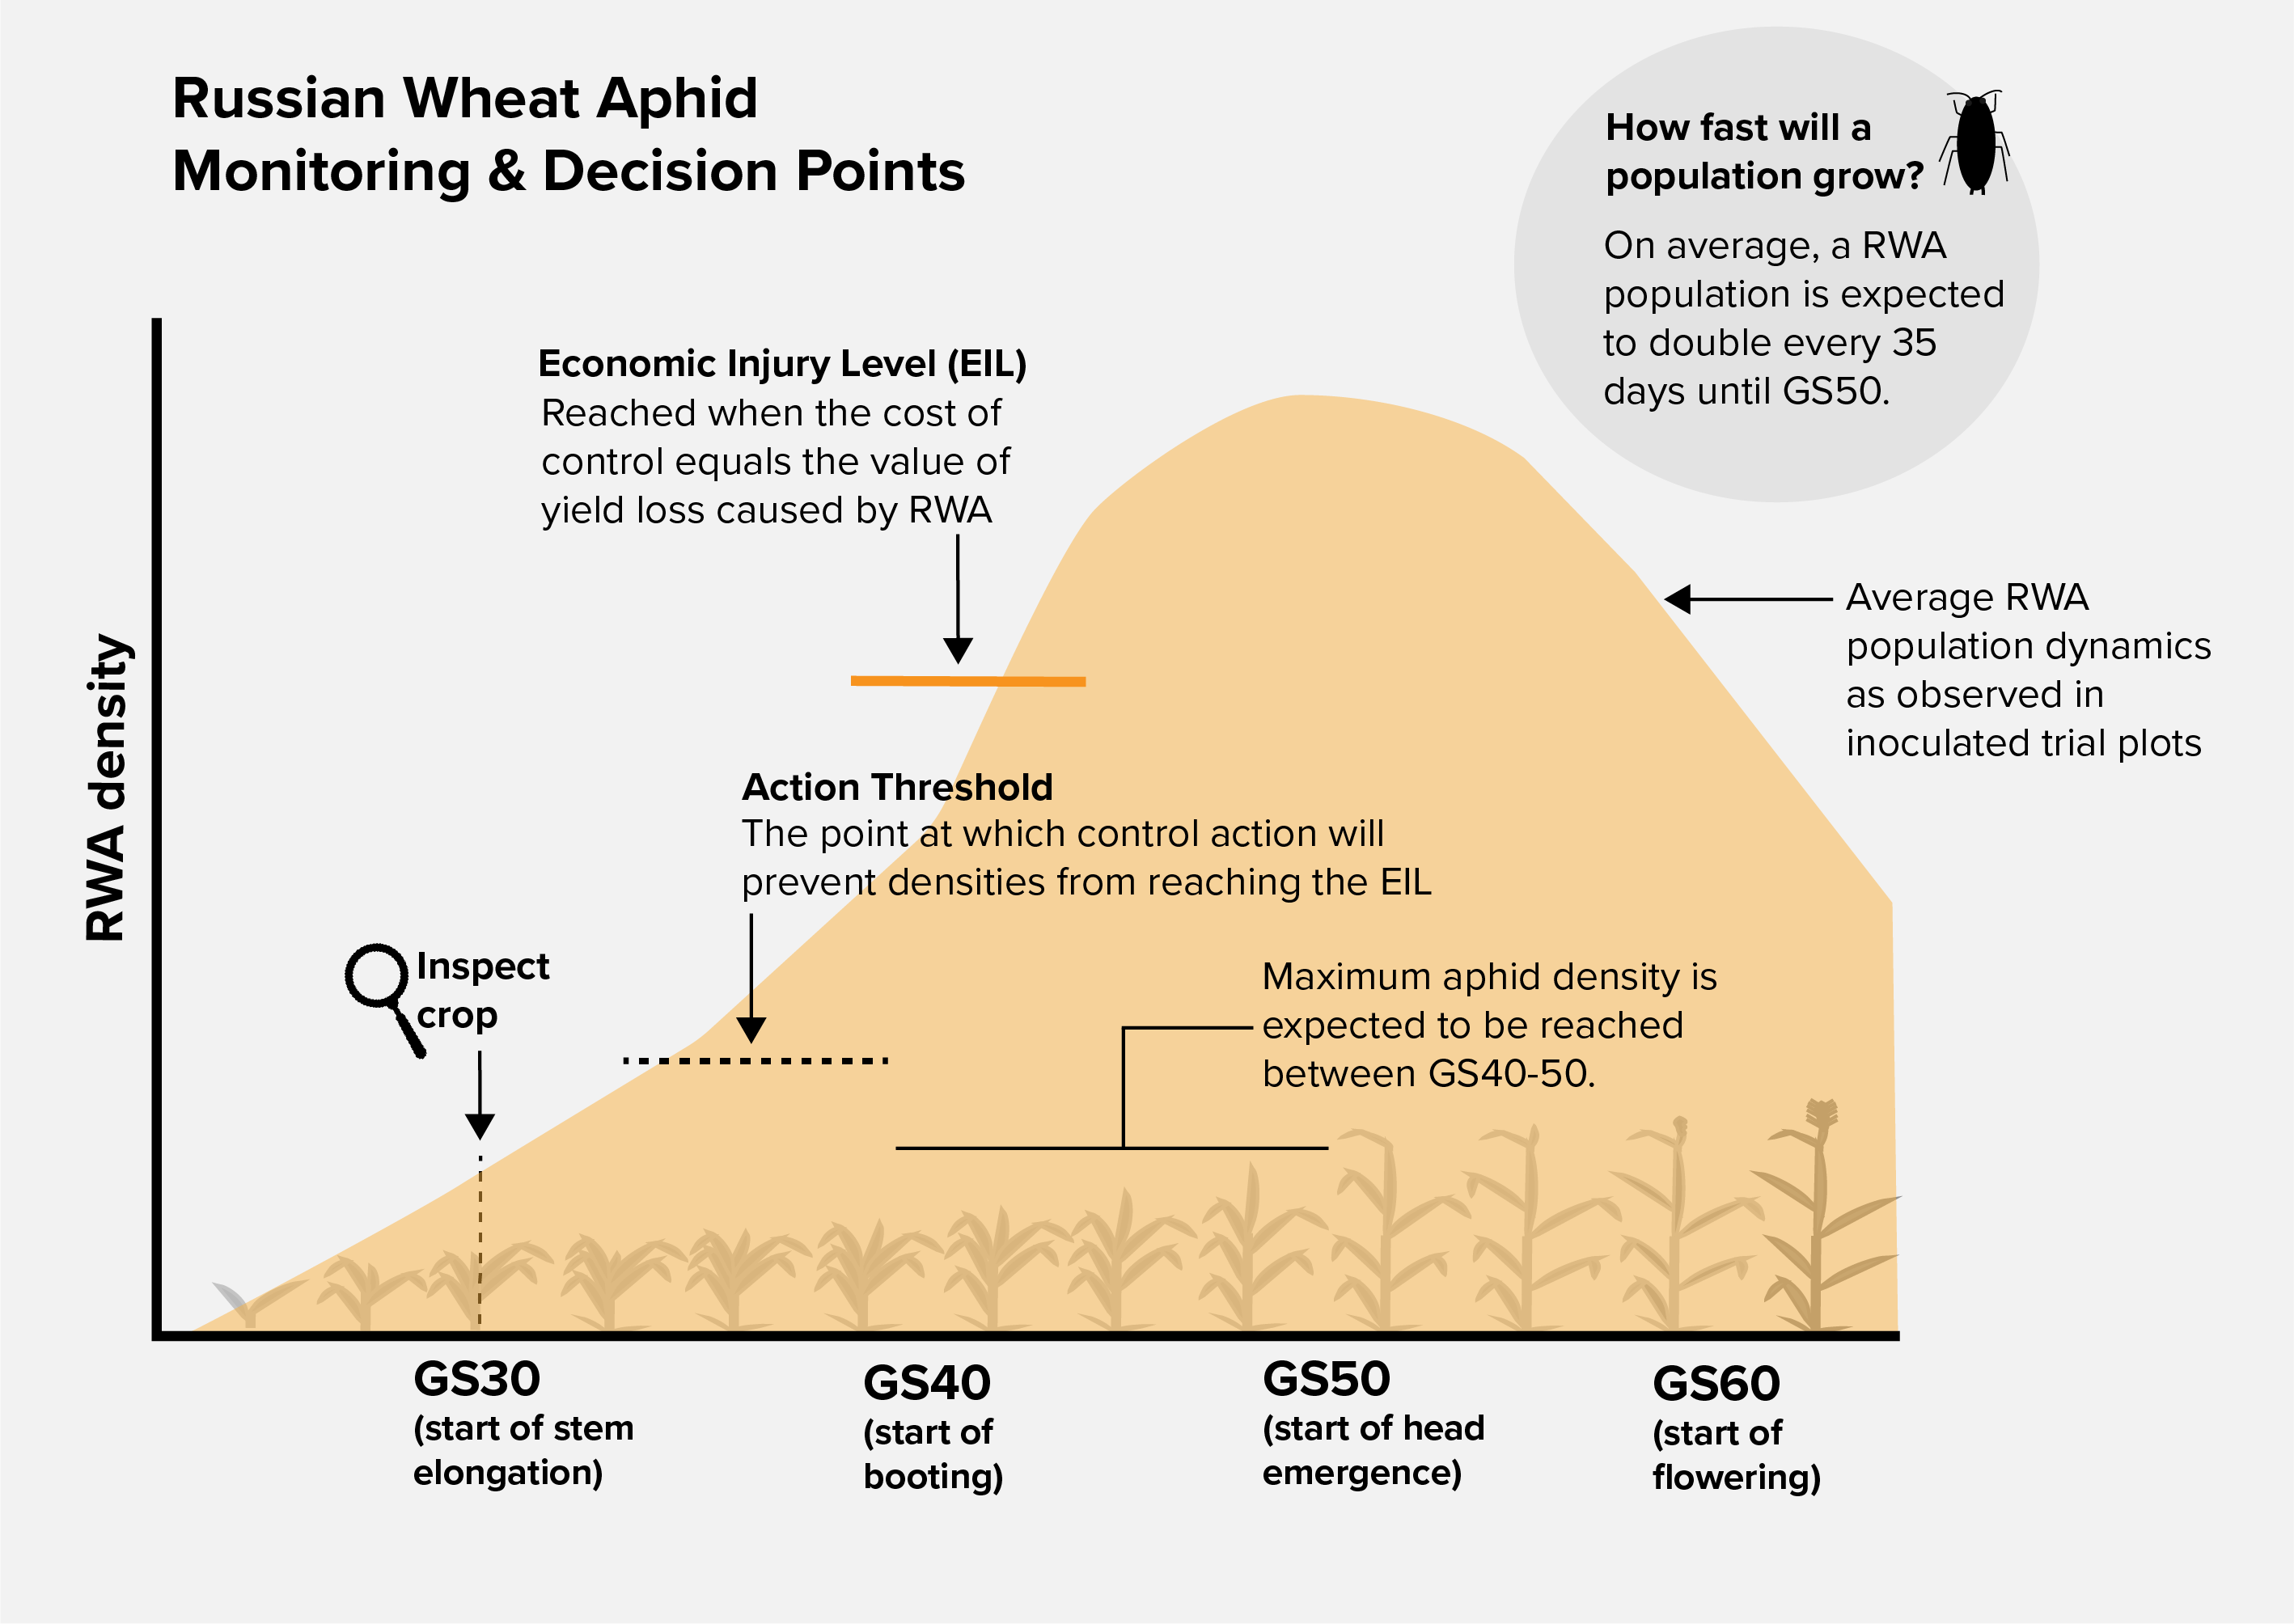
The ‘Economic Injury Level’ (EIL) is reached when the cost of pest control equals the value of yield loss resulting from feeding damage. If pest densities surpass this level, losses will be greater than the cost of control. In this case, aphid control action is the most economically viable option.
If the relationship between pest population density and damage potential is understood it is possible to predict if a pest population is likely to exceed the Economic Injury Level and if action is required (an action threshold).
Due to the delay between crop inspection and pest control, a predictive action threshold is preferred in Integrated Pest Management, as it will factor in the rate of change in aphid pressure during the intervening period.
Most action threshold rules in the grains industry have been set based on field observations and estimation, rather than by collecting data experimentally to test relationships between damage, pest numbers and impact.
Recent research into the Russian wheat aphid has used an experimental approach to collect this type of data.
It is important to emphasise that observations during this research investigation have shown that in low green bridge risk years (dry, hot summer and autumn), infestations reaching economically damaging levels are unlikely.
To collect data that would support development of an action threshold trial sites were set up across regions affected by Russian wheat aphid (RWA) and using several host types and varieties. This allowed the research team to collect a dataset across the area where RWA is currently known to occur, which would lead to regionally relevant management recommendations.
This data was based on three RWA susceptible crops: barley, wheat, durum wheat.
Data was collected during the winter cereal growing season across two years – 2018 and 2019.
The trial work allowed the research team to:
- Identify the best in-field indicator for aphid pressure and predicted yield loss
- Quantify the relationship between this indicator and yield loss
- Quantify aphid growth rates.
Key findings that have been used to form the basis of the Australian intervention rule of RWA are below.
- The best metric for predicting yield loss is percentage of tillers with RWA.
- On average, for each percent of tillers with RWA there is 0.28 % yield loss.
- On average, the RWA population is expected to double every 35 days (see table 1).
Table 1. Expected increase in RWA density after monitoring at the start of stem elongation (GS30)
| Day | % Tillers with RWA |
|---|---|
| 0 | “x” |
| 20 | 1.5X |
| 35 | 2X |
| 46 | 2.5X |
| 55 | 3X |
The maximum percentage of tillers with RWA is usually reached between GS40 (start of booting) – GS50. This is the case for all cereals susceptible to RWA. Predation and parasitism would also be expected to play a role in controlling the aphid population growth rate.
Experimental data was not sufficient to develop an action threshold for infestations detected <GS30. Growers may choose to control infestations at an earlier growth stage, however the cost-benefit cannot be estimated based on current knowledge. Note: The dataset used for determining intervention rule was not sufficient to confirm that infestations eliminated before stem elongation (<GS30) do not cause any yield loss, but overseas research suggests plants can compensate quite well for early attacks.
A control decision should be made based on RWA population densities between GS30 and GS50. Monitoring at GS30 will allow prediction of the aphid density at GS50, and therefore if action is need during that time period.